

Audience research is the single best lever for marketing, product, and growth teams that want to stop guessing and start improving measurable business outcomes. Start by naming the one insight you need; everything that follows should be chosen to deliver that insight. Narrow questions produce decisive answers. Vague ones produce long reports and very little change.
When teams chase every metric or survey a thousand people without a focus, they generate noise, not clarity. The trick is to select metrics that map directly to the decision you need to make: the conversion you want to lift, the churn you want to cut, the messaging confusion you want to resolve. That discipline saves money, speeds decisions, and increases the odds that research will actually change behavior.
This post walks through a practical, repeatable approach: how to pick the right question, find the right people, collect the right mix of quantitative and qualitative evidence, analyze with a bias toward decisions, and deploy insights in a way that moves the needle. You’ll get checklists, experiment ideas, and a compact sprint plan so you can run or scale audience research inside your organization.
Key takeaways
-
Define one high-value research question first. Everything else revolves around it.
-
Combine quantitative and qualitative methods. Numbers show patterns; stories explain them.
-
Segment ruthlessly. Useful insight sits where two or more filters intersect.
-
Turn findings into tests. Insights must feed experiments in messaging, product, or channel.
-
Watch for bias and privacy issues. Cross-check self-report with analytics and respect regulations.
-
Repeat regularly. Mini-audits every 6–12 months keep you current as audiences shift.
Start with the Right Question for Audience Research
Any research plan that starts with a spreadsheet and no question is an expensive exercise in analysis paralysis. Before you write a survey, open analytics, or schedule calls, write a one-sentence research question that ties to a business outcome. Examples:
-
“Why do high-intent trial users drop off during checkout?”
-
“What words do mid-market buyers use when searching for vendor ROI?”
-
“Which onboarding step causes the biggest first-week churn for new users?”
A tight question forces tradeoffs. It determines which segments you’ll sample, which metrics you’ll track, and which qualitative probes you’ll use in interviews. It also limits scope: rather than “Who is our customer?” you ask, “Which behavioral segment produces 80% of trial-to-paid conversions?” The former is a library-scale task; the latter is a focused sprint.
Finally, write a hypothesis next to the question. The hypothesis needn’t be fancy: it’s a working assumption you’ll try to falsify. Having a hypothesis reduces confirmation bias and makes your analysis more rigorous, you design tests to disprove the idea rather than to confirm it.
Identifying and Prioritizing Target Segments for Audience Research
You can’t serve everyone. Start broad to capture possibilities, then filter down to the clusters that matter to your business outcome.
Step 1 , brainstorm widely: list age ranges, industries, use patterns, buying roles, company sizes, and psychographic signals (risk tolerance, price sensitivity, motivations). Step 2, apply ruthless filters: revenue impact, ease of reach, strategic importance, and sample availability.
Use a layered approach:
-
Firmographics: company size, industry, annual revenue.
-
Behavioral: trial length, feature usage, last login, drop-off points.
-
Psychographic: goals, constraints, preferred language, decision triggers.
Magic happens where two or three filters intersect: “mid-market, finance industry, high feature usage but low conversion” is far more actionable than “finance buyers.” Prioritize segments by expected impact and by how quickly you can reach them for research.
Also document your exclusion criteria: who you deliberately aren’t studying and why. That keeps stakeholders aligned and prevents scope creep.
How to Collect High-Quality Quantitative and Qualitative data for Audience research
Good audience research uses both numbers and stories, they play complementary roles.
Quantitative sources
-
Surveys: keep them short and single-minded. One idea per question; 10–12 questions max. Mobile-first design reduces abandonment. Use screening questions to ensure respondents match your prioritized segments.
-
Product analytics: funnel analysis, event dropout, cohort retention, time-to-first-value. These reveal where friction occurs at scale and which segments behave differently.
-
A/B test results and ad metrics: real behavior under controlled conditions. Use them as causal evidence where possible.
Qualitative sources
-
Interviews: 30–45 minutes, loosely structured. Start broad: ask for stories about the last time they tried to solve X, then drill into specifics. Listen for phrasing — those words become copy.
-
Focus groups: use them to surface social dynamics and communal beliefs. A skilled moderator turns polite consensus into revealing conflict.
-
Call and chat transcript mining: sales calls and support chats are treasure troves of unfiltered language and objections.
Other channels
-
Social listening & forums: watch Reddit threads, Twitter/X, Facebook groups, product review sites. Language here is raw and often different from corporate jargon.
-
Competitive content analysis: which competitor posts or product pages get traction? Tools can quantify shares and backlinks but also look qualitatively at comments and questions.
Cross-validation matters: if survey respondents say they “use the product daily” but product analytics say otherwise, investigate the mismatch — it’s often where the real problem hides.
From Themes to Personas and Journey Maps
Raw data without structure is hard to act on. Two synthesis tools work very well: personas and journey maps.
Personas that persuade
Create two or three research-backed personas based on convergent themes. Each persona should read like a real person with:
-
A name & backstory (brief but plausible).
-
Primary goal (what success looks like).
-
Main friction (what prevents success).
-
Decision triggers (events or constraints that prompt action).
-
Preferred channels & content (where they spend time and what they read).
Keep personas pragmatic, anchored to behavior and outcomes, not stereotypes.
Journey maps that reveal moments to change
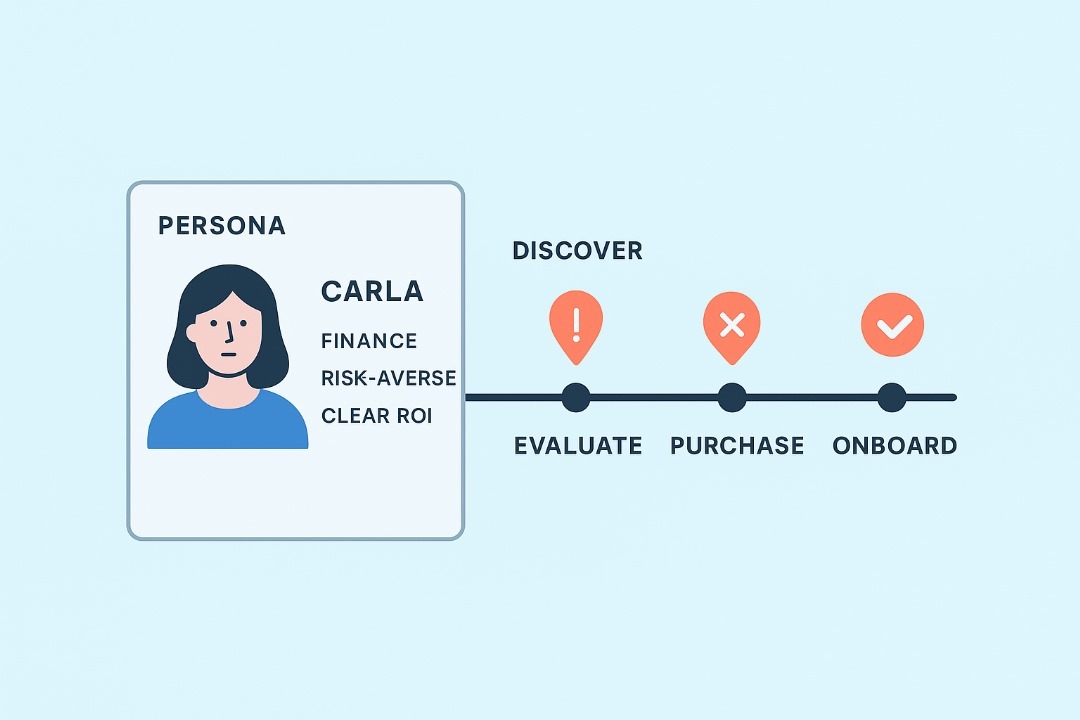
Sketch the step-by-step path each persona takes: discover → evaluate → purchase → onboard → advocate. For each step map:
-
Touchpoints (search, ad, blog, sales demo)
-
Emotions (confident, confused, frustrated)
-
Friction points and friction score (1–5)
-
Opportunity actions (what test or change might reduce friction)
A high-impact output is a prioritized list of 2–3 interventions (copy tweak, funnel fix, onboarding micro-improvement) that map to the highest-friction moments.
Turning Insight into Action: Messaging, Product, and Channel Playbooks
Insights must become experiments. Here’s a simple conversion pipeline:
-
Insight (why users leave at checkout)
-
Hypothesis (adding payment option X will reduce abandonment by Y%)
-
Experiment (A/B test checkout with/without option X)
-
Decision (roll out, iterate, or scrap).
Messages that convert
Use exact phrases your users use. If interviewees say “integration headaches” rather than “implementation complexity,” test the simpler phrase on landing pages and ads. Small wording changes often have big lift.
Product fixes with the smallest scope
When interviews point to onboarding complexity, start with the smallest change that could plausibly move the metric: a tooltip, a 2-minute welcome video, or a “recommended setup” checklist. Run these as quick experiments and measure cohort behavior.
Channel selection and sequencing
Don’t try to be everywhere. Pick two channels where your personas naturally spend time and design content specific to each. For each channel, define a micro-funnel: awareness → primary action → conversion. Measure and optimize.
Smart Segmentation and Experimentation
Once you’ve identified segments and hypotheses, test with precision. Here are practical steps to run tight experiments:
-
Bold, focused segments. Combine filters (e.g., mid-market finance buyers who used feature Y within 14 days).
-
Small, fast experiments. Use small ad buys or an email cohort to validate an idea before a full product change.
-
Compare lift, not vanity. Track conversion uplift, retention, LTV, or NPS improvements, not just clicks.
Three quick tests
-
Test 1: Landing page copy swap using language pulled from interviews. Measure trial starts and CTRs.
-
Test 2: Onboarding micro-change (e.g., add a “first task” checklist). Measure first-week retention.
-
Test 3: Channel play-run a tightly targeted paid test with new creative and compare CAC by segment.
Iterate rapidly: prune failing ideas, scale winners, and always keep the original business question visible so experiments remain relevant.
Avoiding Research Pitfalls
People and data both have failure modes. Here are common myths and how to avoid them.
-
Myth: Bigger sample always wins.
Reality: A huge, irrelevant sample amplifies noise. Prioritize a representative sample of the segment that matters.
Fix: Use screening questions and analytics filters to reach the right cohort. -
Myth: Self-reported behaviour equals real behaviour.
Reality: People overestimate usage or adopt socially desirable answers.
Fix: Cross-check with product analytics or purchase logs. -
Myth: One research run is enough.
Reality: Markets and behaviors shift. One snapshot becomes stale.
Fix: Schedule mini-audits every 6–12 months and trigger extra research after product or market changes. -
Myth: Confirmation bias is harmless.
Reality: Framing questions or cherry-picking quotes leads to costly wrong moves.
Fix: Present raw transcripts, visual heatmaps, and conflicting evidence side by side; include an “outsider” reviewer. -
Myth: Privacy is an afterthought.
Reality: Regulations and trust matter; mishandling data is reputational and legal risk.
Fix: Anonymize data, seek consent, and follow GDPR/CCPA guidance in study design.
If you want a compact way to inoculate the team: require that every insight slide include the sample frame, sample size, and at least one piece of cross-validation (e.g., analytics metric) before stakeholders act.
Tools, Ethics, and What Comes Next
The toolkit for audience research keeps expanding. New platforms help you scale listening and pattern detection, but they raise new questions.
Tools to consider
-
Quant analytics: Google Analytics / GA4, Mixpanel, Amplitude.
-
Survey & interview: Typeform, Qualtrics, UserTesting, Lookback.
-
Listening & competitive: SparkToro (audience affinities), Brandwatch, Reddit/X search.
-
Call/meeting mining: Gong, Chorus — they surface recurring objections and language.
-
AI augmentation: Topic modeling and sentiment analysis can surface emergent themes faster, but always validate with human reads.
Ethics & privacy
Follow best practices: obtain informed consent for interviews, anonymize identifiers when reporting, and minimize collection of PII. Consider techniques like aggregation, differential privacy, and synthetic reporting where appropriate.
The future
Expect listening to move from sample surveys to continuous streams: product events, call transcripts and passive behavior signals fused to create living audience models. That’s powerful — but it requires vigilance about bias, data governance, and human oversight.
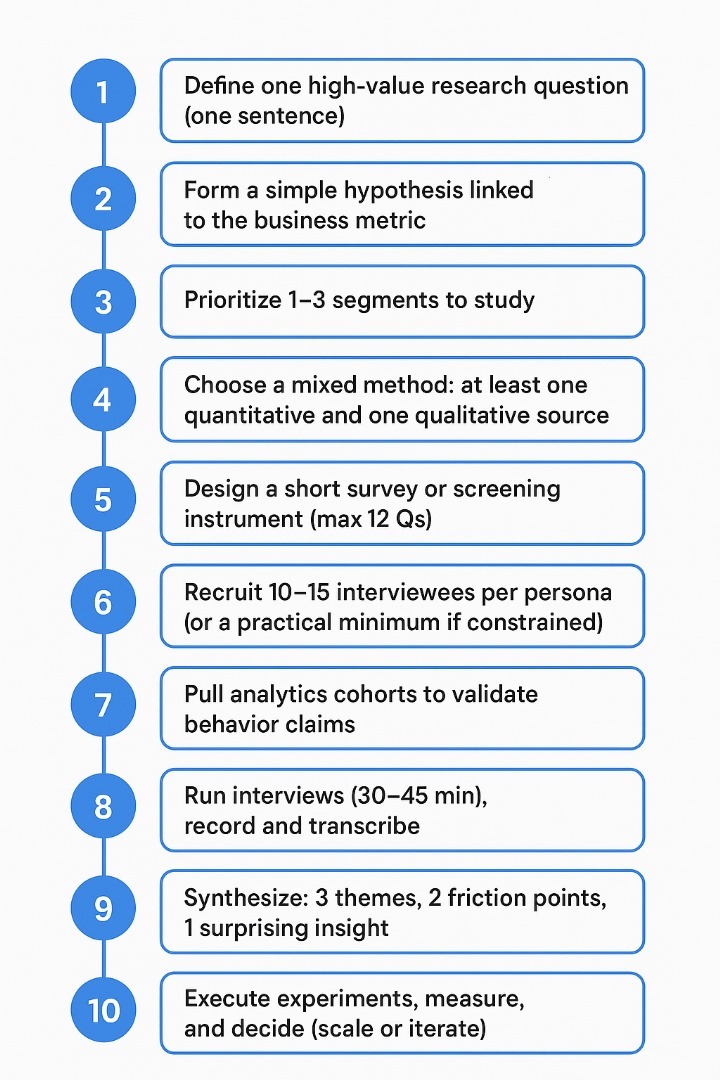
Checklist: Run an Audience Research Sprint (Copyable)
-
Define one high-value research question (one sentence).
-
Form a simple hypothesis linked to the business metric.
-
Prioritize 1–3 segments to study.
-
Choose a mixed method: at least one quantitative and one qualitative source.
-
Design a short survey or screening instrument (max 12 Qs).
-
Recruit 10–15 interviewees per persona (or a practical minimum if constrained).
-
Pull analytics cohorts to validate behavior claims.
-
Run interviews (30–45 min), record and transcribe.
-
Synthesize: 3 themes, 2 friction points, 1 surprising insight.
-
Create 2 personas and 1 journey map for the priority segment.
-
Propose 2–3 experiments linked to the hypothesis and metric.
-
Execute experiments, measure, and decide (scale or iterate).
This checklist runs in 2–4 weeks for a tight sprint, depending on recruitment speed and experiment complexity.
Language, Reporting, and Handoff
When you deliver research to stakeholders, structure the report so it’s action-first:
-
Start with the one question and the headline decision.
-
Provide the key evidence (one analytics chart, two quotes, one experiment result).
-
Present personas and prioritized experiments.
-
Finish with a two-column table: “What we’ll do” / “How we’ll measure it” to make follow-through explicit.
Use simple, exact language drawn from interviews in your copy and your test hypotheses. That alignment between user voice and brand voice is what converts.
References for further reading
-
Nielsen Norman Group — research methods and qualitative synthesis.
-
SparkToro — Audience Research: The Complete Guide for Marketers in 2025

Discover more from Aree Blog
Subscribe now to keep reading and get access to the full archive.


